DBOS Debugger
The DBOS Debugger VS Code extension enables you to replay debug your application using data from your local database or from DBOS Cloud.
Installation
For VS Code setup instructions, please see Microsoft's official documentation.
The DBOS Time Travel Debugger Extension can be installed via the VS Code Marketplace website or by searching the VS Code Extension Marketplace for "DBOS".
Views
As of v1.2 of the DBOS Time Travel Debugger Extension, you can view your DBOS Cloud applications and database instances directly inside VS Code. Hovering over a cloud resource provides additional information in a tooltip.
Commands and Menu Items
These commands can be invoked via the VS Code Command Palette or from menu items in the DBOS Cloud Resources view.
Log Into to DBOS Cloud
You must log into DBOS Cloud from VS Code to populate the DBOS Cloud resources view and to use the Cloud Replay Debugger.
Typically, the extension will automatically prompt you to login to DBOS Cloud if you're not logged in or your credentials have expired. However, this command can also be executed explicitly.
Delete Stored DBOS Cloud Credentials
This commands logs the user out of DBOS Cloud and deletes any previously stored credentials.
Browse DBOS Cloud App
This commands launches the user's default browser and navigates to the root URL of the DBOS application.
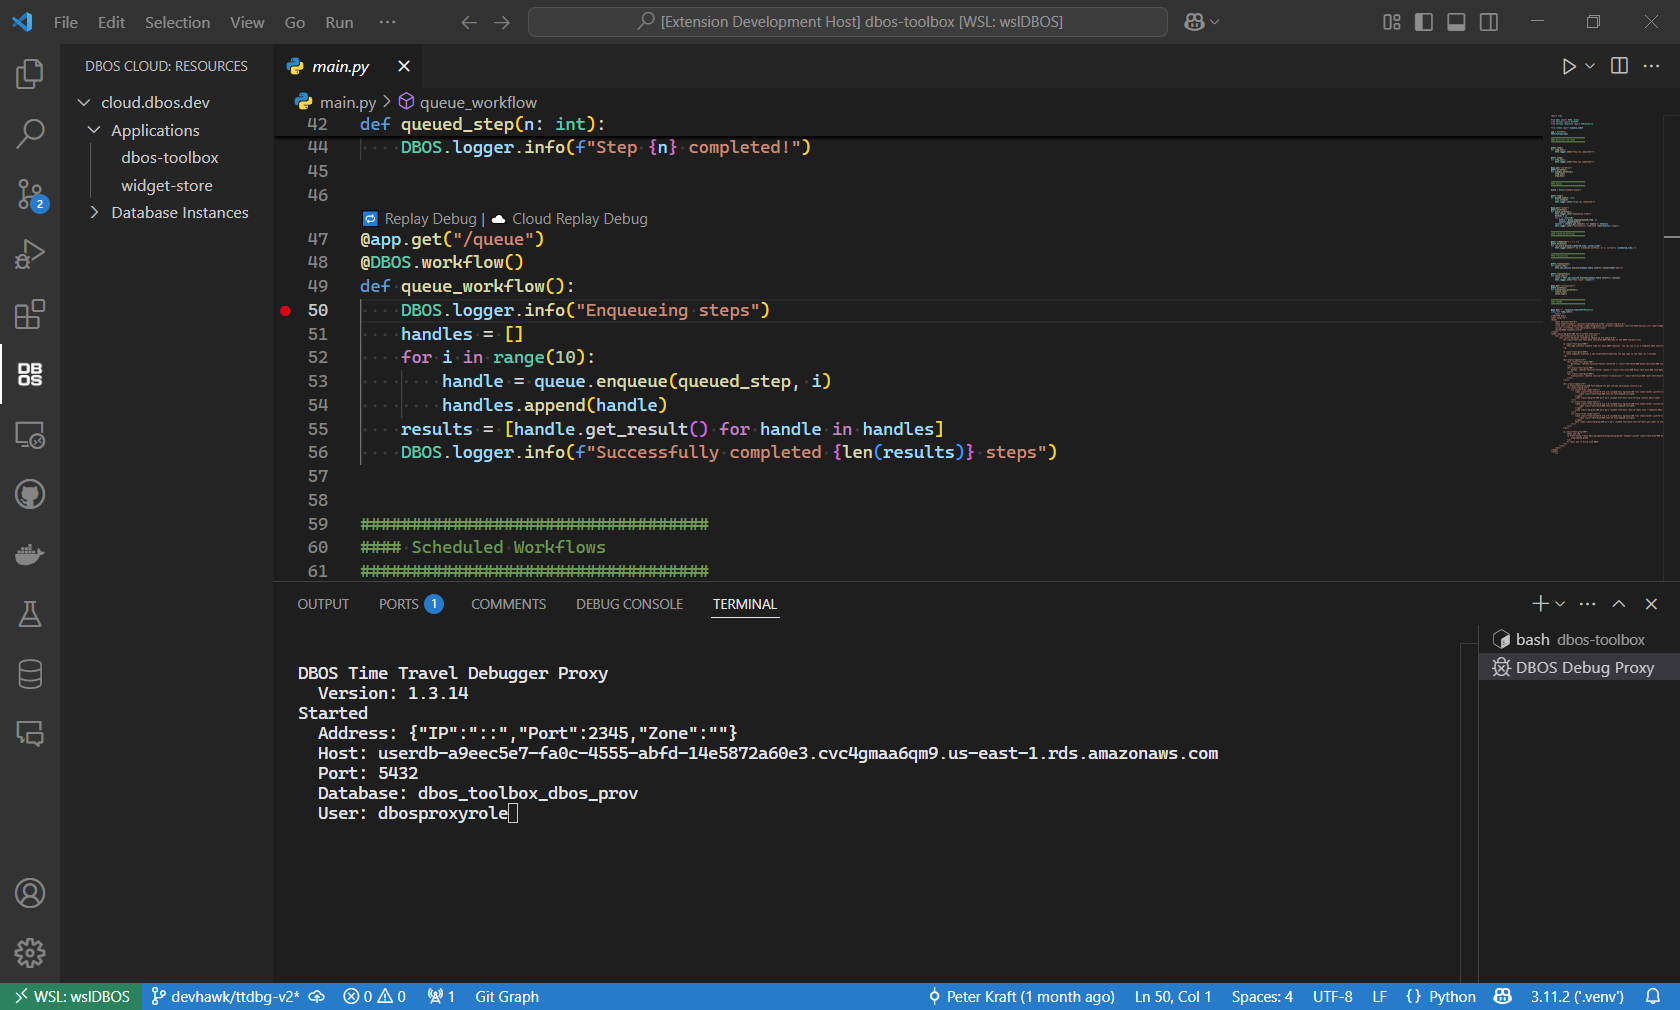
Launch Time Travel Debugging Proxy
Interactive time travel relies on Debug Proxy utility to project the state of the database as it existed when a selected workflow started.
You can launch the Debug Proxy in order to use psql or other similar tools for running interactive time-traveled queries.
When the Debug Proxy is running, its output appears in a VSCode terminal window. You cannot interact with the Debug Proxy via this window, but you can shut it down with Ctrl-C.
Configuration
Some behavior of the extension can be controlled via VS Code Settings.
dbos-ttdbg.debug_proxy_port
The Time Travel Debugging Proxy listens on port 2345 by default. This port can be changed via the dbos-ttdbg.debug_proxy_port configuration setting.
dbos-ttdbg.debug_proxy_path
The dbos-ttdbg.debug_proxy_path configuration setting allows the user to use a different debugging proxy than the one automatically downloaded byt DBOS Debugger.
This setting is typically used by internal DBOS developers when making changes to the Time Travel Debugging Proxy.
dbos-ttdbg.debug_proxy_prerelease
By default, the DBOS Debugger will automatically download the latest release build of the Time Travel Debugging Proxy for the user's operating system.
The dbos-ttdbg.debug_proxy_prerelease configuration setting allows the user to specify they want preview releases as well.
dbos-ttdbg.just_my_code
By default, the DBOS debugger is configured to skip code
that is not a part of the DBOS application.
In practice, this means skipping any code installed under node_modules as well as core modules that ship with Node.
You can disable this skipping with the dbos-ttdbg.just_my_code configuration setting.